
Why Central Banks Buy Gold (and Why It Matters to Traders)
Reserve diversification, de-dollarisation, and the steady official demand that quietly sits under gold's price. The macro context a trader should actually know.
Gold does not move on vibes. It moves on real yields, the dollar, central-bank demand, and fear. Here is how each one shows up on your chart, and why reading the trend beats guessing the headline.
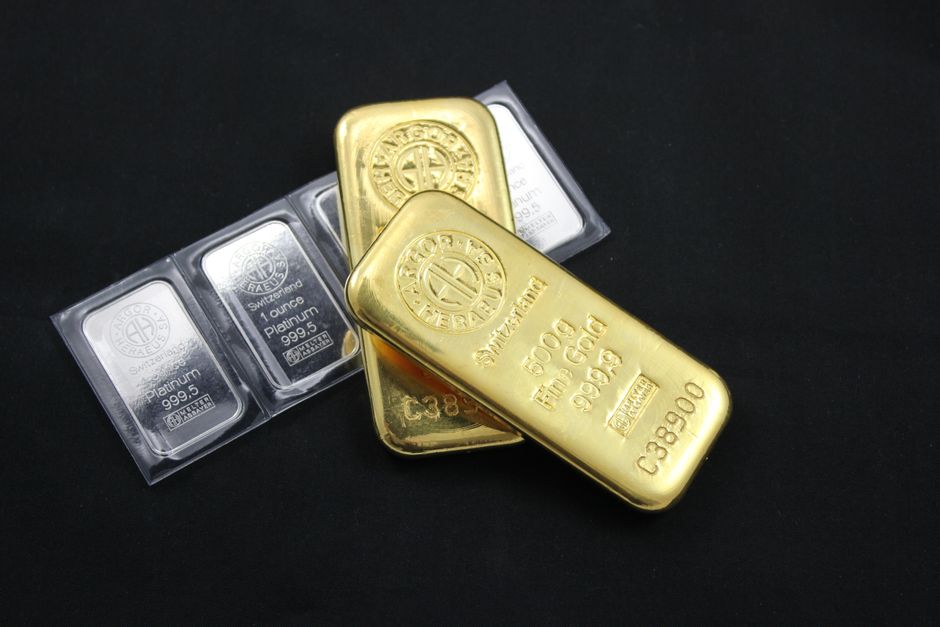
Gold has no earnings call, no product roadmap, and no CEO to blame. It just sits there, shiny and stubborn, while its price swings on forces most people never see. Ask ten traders what moves the price of gold and you will get ten answers, usually involving inflation, war, or a vague gesture at "uncertainty." Some of that is right. Most of it is fuzzy.
The truth is narrower and more useful. Four drivers do the bulk of the work: real yields, the US dollar, central-bank demand, and safe-haven flows. Learn to spot each one on a chart and the metal stops looking random. It starts looking like the sum of a few big, slow-moving forces that leave fingerprints you can actually read.
Here is each driver, what it does, and how it shows up when you pull up XAU/USD.
Start with the one that matters most and gets talked about least. A real yield is an interest rate with inflation stripped out. If a government bond pays 4 percent and inflation runs at 3 percent, the real yield is roughly 1 percent. That is what your money actually earns after prices erode it.
Gold pays you nothing. No coupon, no dividend, no interest. So the cost of owning it is the yield you gave up by not holding something that does pay. When real yields fall, that cost drops, and gold tends to look more attractive. When real yields rise, cash and bonds start paying you to wait, and gold has to compete against that. It often loses.
This is the relationship that explains a lot of moves that otherwise seem strange. Gold can climb while the economy looks fine, or sag while fear is in the air, because underneath it all real yields shifted.
You will not see real yields plotted on your gold chart directly, but you can feel them. Long, grinding uptrends in gold often line up with periods when central banks are cutting or expected to cut. Long downtrends often line up with aggressive hiking. When you see gold trending hard with no obvious headline, real yields are usually the story.
If you want the raw relationship, real yields also drive the metals more than the headline inflation print does. That is why does inflation drive the gold price is a more complicated question than it sounds, and why chasing every CPI release is a losing game.
Gold is quoted in dollars everywhere on earth. So the dollar's own strength changes gold's price before anything about gold changes at all.
When the dollar strengthens, an ounce of gold costs more in euros, yen, and rupees, which cools foreign demand. When the dollar weakens, gold gets cheaper for everyone outside the US, and demand tends to firm up. On top of that mechanical effect, a strong dollar usually travels with higher US real yields, so the two forces often push gold the same direction at once.
The shorthand traders use is the inverse relationship: dollar up, gold down, and the reverse. It holds often enough to be worth watching and breaks often enough that you should never bet the farm on it. Some of gold's most memorable runs happened while the dollar was also firm, because central-bank buying or fear overwhelmed the currency effect.
Pull up the dollar index (DXY) next to gold. Much of the time you will see two charts that look like mirror images. When they stop mirroring each other, that is a signal worth respecting, because it usually means one of the other three drivers has taken the wheel. If you want to go deeper on the mechanics, how the DXY affects gold breaks the pairing down further.
Here is the driver retail traders underweight the most. Central banks are among the largest holders and buyers of gold on the planet. When they add to reserves, they do it in size, and they do it for reasons that have nothing to do with your chart timeframe.
This demand is patient and structural. A central bank diversifying away from dollar reserves is not day-trading. It is building a position over quarters and years. That steady, price-insensitive buying puts a floor under the market and can keep gold firm even when real yields and the dollar say it should be falling.
You cannot time this driver, and you should not try. What you can do is respect it. When gold refuses to break down despite a strong dollar and rising yields, structural demand is often the reason. It is the tide under the waves. For the why behind it, why central banks buy gold covers the reserve logic in plain terms.
Central-bank demand rarely produces sharp candles. It shows up as resilience: dips that get bought, downtrends that stall, a market that feels heavier to push down than the macro backdrop suggests. If gold keeps making higher lows in a year when it "should" be weak, this is a prime suspect.
This is the driver everyone knows and most people overrate. When markets panic, some money runs to gold. Wars, banking scares, sudden crashes: fear can send a fast, sharp bid into the metal as people reach for something that has held value for a very long time.
The catch is that these flows are fast and fickle. They spike and they fade. A geopolitical shock can rip gold higher for a few sessions and then leave just as quickly once the panic cools. Safe-haven demand is real, but it is the least reliable of the four to trade, because by the time you have read the headline, the move is often half over.
Safe-haven flows produce the violent, gappy candles: a sudden vertical push on a shock, often with a long wick as the panic buying gets sold into. These are the moves that look dramatic and lure people into chasing. They are also the moves most likely to reverse on you. If you have ever bought a fear spike and watched it round-trip, you have met this driver personally.
Here is the problem with trying to trade gold off the news. At any given moment, all four drivers are acting at once, and they frequently disagree.
Real yields might say sell while central-bank demand says hold. The dollar might be strong while a war spikes safe-haven buying. You could read every economic release perfectly and still get the direction wrong, because you weighted the wrong driver for that particular week.
| Driver | Speed | How it looks on the chart |
|---|---|---|
| Real yields | Slow | Long trends with no obvious headline |
| The dollar | Daily | Mirror image of DXY, most of the time |
| Central-bank demand | Very slow | Resilience, bought dips, stalled downtrends |
| Safe-haven flows | Fast | Sharp spikes with long wicks, quick fades |
Look at that table and notice something. You do not have a live feed of real yields on your chart. You cannot see central-bank order flow. You get the safe-haven headline after the move. The one thing you can see clearly, all four drivers already baked in, is price itself.
That is the whole case for reading the trend instead of predicting the story. The chart is the net result of every force, weighted correctly in real time by the market, without you having to guess which driver wins this week. When gold is in a clean daily uptrend, the four forces are net bullish, whatever the reason. You do not need to name the reason to follow the trend.
This is why a lot of durable gold approaches lean on trend following rather than macro forecasting. You are not trying to out-analyze the world's central banks. You are trying to notice when the sum of their behavior has picked a direction, and to ride it until it turns. The daily timeframe is a sweet spot for this: slow enough to filter out safe-haven noise, fast enough to catch the real-yield trends while they are still running.
None of this makes gold predictable. Trends turn, fear spikes fake you out, and the driver that mattered last quarter may not matter next. Any position can lose, and no read of the drivers changes that. What this framework does is stop you from being surprised. You will know why gold is moving even when the headline says otherwise, and you will know why chasing that headline usually costs you.
If you take one thing from this: stop trying to predict the four drivers and start reading what they have already done to the chart. A tool like Vektor exists to do exactly that. It reads the trend on gold and Bitcoin, tells you long, short, or flat, and waits most of the time rather than reacting to every spike. It plots the exit as a trailing stop that follows the trend and does not repaint, and it can show its result next to buy-and-hold right on your chart so you can judge it for yourself.
The market has already weighed real yields, the dollar, central banks, and fear for you. Your job is to read the answer, not re-derive the question.
Over the medium term, real yields tend to be the heaviest single lever. When real yields fall, gold usually catches a bid, because the cost of holding a metal that pays no interest drops. The dollar, central-bank demand, and safe-haven flows fill in the rest. No single driver rules every week, which is why a chart that reads the net result beats weighing each factor by hand.
Not directly. Gold cares more about real yields than the raw inflation number. If inflation runs hot but central banks raise rates faster, real yields rise and gold can stall or fall even while prices climb. Inflation matters, but mainly through what it does to real rates and to how nervous people feel about holding cash.
Gold is priced in dollars globally, so when the dollar strengthens, gold gets more expensive for buyers using other currencies, which softens demand. A strong dollar also usually signals higher US real yields, and those two forces tend to pull the same way. It is a tendency, not a law, so watch the chart rather than assuming it holds every day.
Rarely, and not reliably. The market often prices in an event before it happens, then moves the opposite way when it lands. Instead of forecasting headlines, most durable approaches read the trend that all these forces have already produced and follow it until it turns.
Reserve diversification, de-dollarisation, and the steady official demand that quietly sits under gold's price. The macro context a trader should actually know.
Gold holds purchasing power over long stretches, but it pays you nothing to wait. Here is the sober case for and against owning it.

Chasing candles and reacting to headlines gets gold traders wrong-footed. A confirmed daily break gives you a rule you can repeat instead of a hunch you have to defend.