
Why Central Banks Buy Gold (and Why It Matters to Traders)
Reserve diversification, de-dollarisation, and the steady official demand that quietly sits under gold's price. The macro context a trader should actually know.
Trend tools, volatility tools, and the two things that move gold more than any oscillator. How to judge an indicator for gold specifically.
Search for the best indicator for gold trading and you will get a hundred confident answers, most of them contradicting each other, most of them trying to sell you a template. Here is the honest version: there is no single best indicator for gold trading, because "best" depends entirely on how you trade, what timeframe you use, and whether the tool can actually handle gold's temperament. What helps a scalper on the 5m is noise to a swing trader on the daily. So instead of naming a winner, let me show you the categories that matter for gold, and how to judge any one of them for this specific market.
Gold is not a slow, well-behaved index. It trends hard, it gaps, and it moves in ranges that would make a stock trader nervous. Any tool you put on it has to survive that.
Gold's whole appeal is that it trends. When it decides to go, it goes, and the traders who do well are usually the ones who caught the direction and held it. That makes trend tools the backbone of most gold setups.
Moving averages are the plain, honest starting point. A single moving average gives your eye a reference for direction: price above a rising average is an uptrend, price below a falling one is a downtrend. Two averages crossing can flag a shift. They are simple, they do not repaint, and they will not lie to you. Their weakness is lag and chop. In a sideways gold market, a moving average whips back and forth and generates trades that go nowhere.
Supertrend is a step up in usefulness for a lot of gold traders because it is built on volatility rather than just price average. It flips between long and short and, importantly, it draws a line you can use as a trailing stop, which suits gold's tendency to run. It has the same core weakness as any trend tool, though: in a range it flips repeatedly and hands you a string of small losses. If you want the full mechanics of how it works and where it breaks, read our Supertrend indicator explained breakdown before you rely on it.
The honest takeaway on trend tools: they are excellent when gold trends and painful when it ranges. No trend indicator fixes that, so your job is to recognize the range and stop trading the tool through it.
Here is the tool most beginners ignore and most professionals never trade without: ATR, or Average True Range. It does not tell you direction. It tells you how much gold is moving right now, and for gold that is not optional information.
Gold moves in big ranges. If you set a fixed stop distance, say a flat number of dollars, you will place stops that are far too tight when volatility spikes and get stopped out by ordinary noise, then watch price go exactly where you thought. Scale your stop to ATR instead and your risk adapts to current conditions. Wide-swinging days get more room, calm days get less.
That is the real job of a volatility tool for gold: sizing your stop and your position to reality instead of to a number you made up. Direction gets the headlines, but risk sizing is what keeps you in the game long enough for the direction to matter.
This is where most "best indicator" articles quietly mislead you. They obsess over which oscillator to slap on the chart and skip the forces actually driving the price the oscillator is reading.
Gold is priced in dollars and pays you no interest. Two things push it around harder than any RSI setting:
And it does not move evenly through the day. The London and New York sessions, especially their overlap in the New York morning, are when volume and volatility peak and when US data lands. An oscillator screaming "overbought" during a dead Asian session hour is a very different signal from the same reading as US data hits.
So before you fuss over indicator settings, know when gold is awake and what is shoving it around. That context will save you from more losing trades than any parameter tweak. If you want the practical setup, our guide on how to trade gold on TradingView walks through the sessions and chart step by step.
Most indicators were designed on generic price data, not on something as jumpy as gold. Before you trust one for this market, put it through a few honest tests.
An indicator tuned for slow, orderly markets will fire constantly on gold and bury you in false signals. Watch it on real gold data across both calm and violent stretches. If it only looks good in the quiet periods, it will not help you when gold does what gold does.
Gold gaps, especially around the weekly open and around major news. Some indicators calculate cleanly across a gap, others produce a garbage reading on the first candle after one. If a tool spits out a wild signal every Monday open, that is a red flag.
This is the big one, and it is where a lot of flashy tools quietly cheat. A repainting indicator changes its past signals after the fact. The historical chart looks flawless because the tool rewrote its own history, but the live signals never match what you saw. To check, watch it in real time as candles close and compare against the historical version. If arrows or lines move or disappear after the bar closes, it repaints, and the backtest is a fantasy. A non-repainting tool shows you on history exactly what it would have shown you live. That is the only kind worth trusting with real money.
A good tool lets you check its logic and its results yourself instead of asking you to trust a screenshot. If you cannot see how it would have behaved on past gold data, you are buying faith, not evidence.
Here is a quick scorecard for judging any gold indicator:
| Test | What you want to see |
|---|---|
| Volatility | Holds up in both calm and wild gold conditions |
| Gaps | Clean readings across weekly and news gaps |
| Repainting | Live signals match the historical chart exactly |
| Verifiability | You can check the logic and results yourself |
For what it is worth, Vektor was built for gold and Bitcoin with exactly these problems in mind: it reads the trend, waits most of the time, and trails its stop with the market's volatility rather than a fixed distance, and it does not repaint, so what you see is what actually happened. It is one honest example of the checklist above, not the only tool that can pass it, and it is analysis for information only, not financial advice.
Start with your style. If you are a trend trader, a clean moving average or Supertrend to define direction plus ATR to size your stop is a complete, honest toolkit, and it will beat a chart buried under ten oscillators. If you day-trade the sessions, the same trend-plus-volatility pairing works, you just apply it on a lower timeframe and pay closer attention to the New York open.
What you do not need is a stack of momentum indicators all telling you the same thing in slightly different colors. Two tools you understand, one for direction and one for risk, beat five you cannot read. And every one of them should be judged against real gold data, not a marketing screenshot. If you are still weighing whether to buy a tool at all, our roundup of the best paid TradingView indicators covers what actually justifies the price.
Trading is risky and you can lose money, so whatever you land on, the point is not to find a magic signal. It is to pick a tool you understand, confirm it does not repaint, size your risk to gold's volatility, and stay on the right side of the trend during the hours gold actually moves. That combination beats hunting for a perfect indicator every time.
There isn't one, and anyone selling you a magic bullet is selling you something. The best indicator for gold trading depends on your style and timeframe. Trend traders lean on moving averages or Supertrend to stay on the right side of the move. Anyone using stops should know ATR to size stop distance to gold's volatility. What matters more than the specific tool is that it fits how you trade and that it does not repaint.
Average True Range measures how much gold is actually moving, and gold moves in big ranges. If you set a fixed stop distance without checking ATR, you will place stops that are too tight in volatile conditions and get picked off by normal noise. Scaling your stop to ATR means your risk adapts to current volatility instead of a number you guessed. It does not predict direction, it sizes your risk to reality.
A repainting indicator changes its past signals after the fact, so the backtest looks great but the live signals never match it. To check, watch it in real time as candles close and compare against what it shows on the historical chart. If arrows or lines move or vanish after the bar closes, it repaints. A non-repainting tool shows you on history exactly what it would have shown live, which is the only version worth trusting.
Often, yes. Gold is priced in dollars and pays no yield, so it reacts hard to the dollar and to interest rate expectations, and its biggest moves cluster in the London and New York sessions. An indicator reads price, but price is being driven by those forces. Knowing when gold is active and what is pushing it will save you from more bad trades than swapping one oscillator for another.
Reserve diversification, de-dollarisation, and the steady official demand that quietly sits under gold's price. The macro context a trader should actually know.
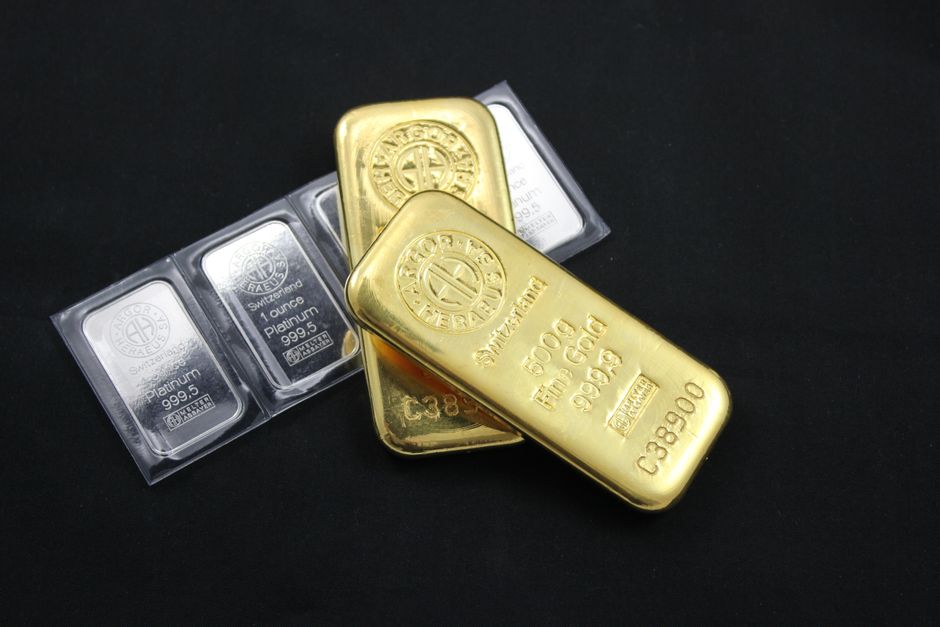
Gold does not move on vibes. It moves on real yields, the dollar, central-bank demand, and fear. Here is how each one shows up on your chart, and why reading the trend beats guessing the headline.
Gold holds purchasing power over long stretches, but it pays you nothing to wait. Here is the sober case for and against owning it.