Six real captures of Vektor on the Bitcoin 4-hour chart, straight from TradingView — shown in order, bad years first. Nothing is recoloured and no loser is cropped out. Load Vektor on your own chart, scroll back, and it will match, candle for candle.
01 · Mar 2021 — Mar 2022BTCUSDT · 4H · Real screenshot
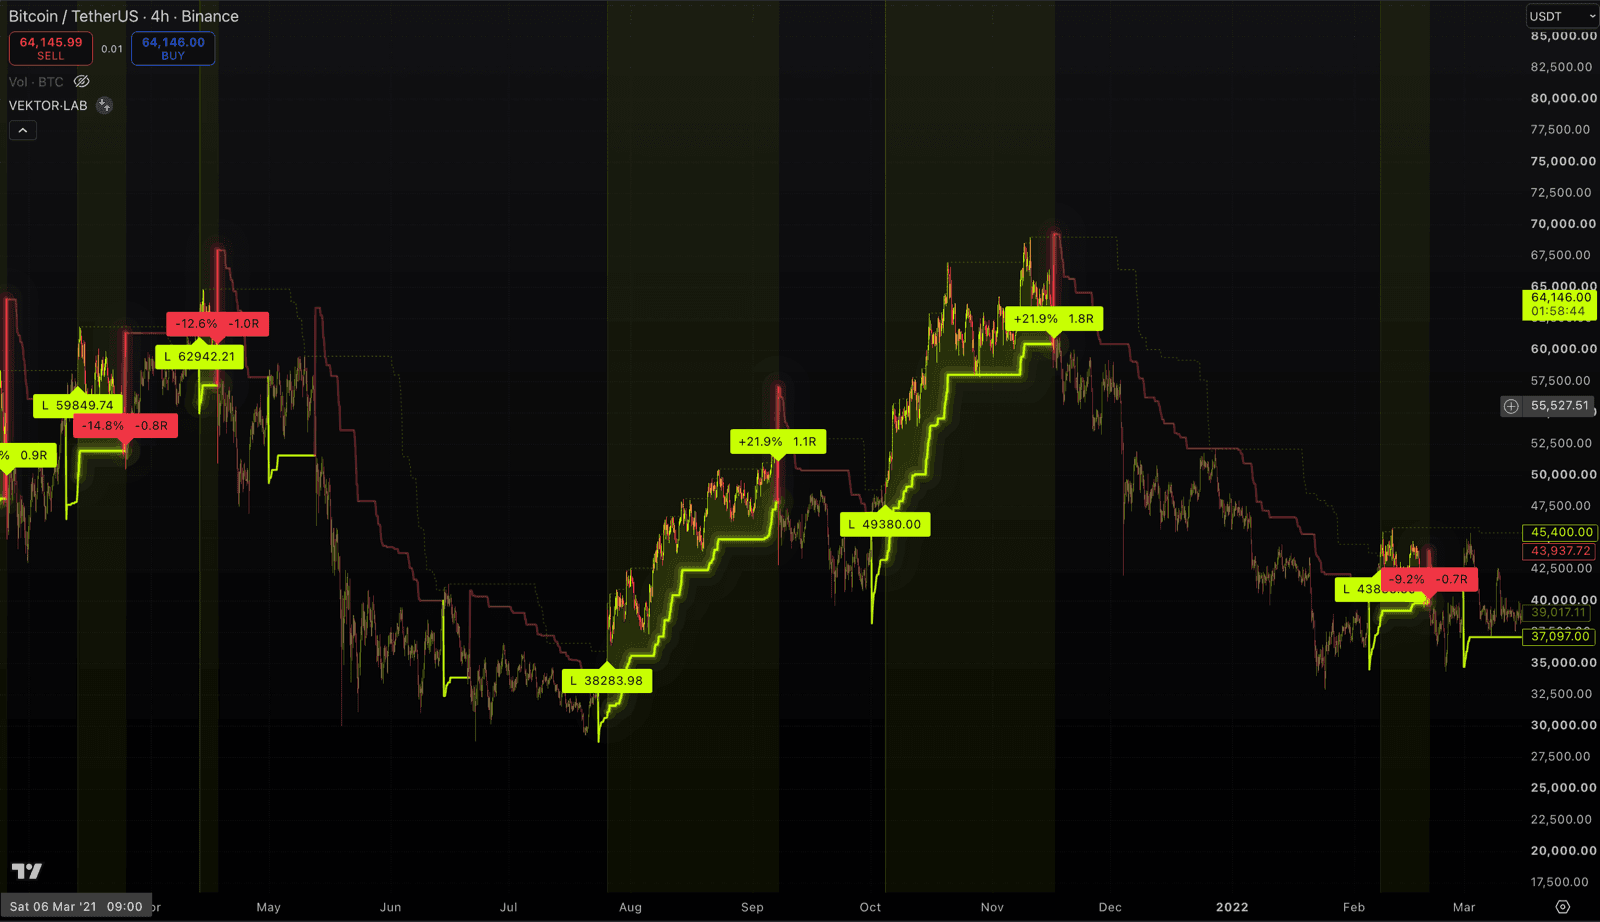
The chop yearA hard year, on tape. Two winners near 2R, three losers around 1R, and long stretches holding nothing at all. This is what rules look like when the market goes sideways.
02 · Jul — Dec 2022BTCUSDT · 4H · Real screenshot
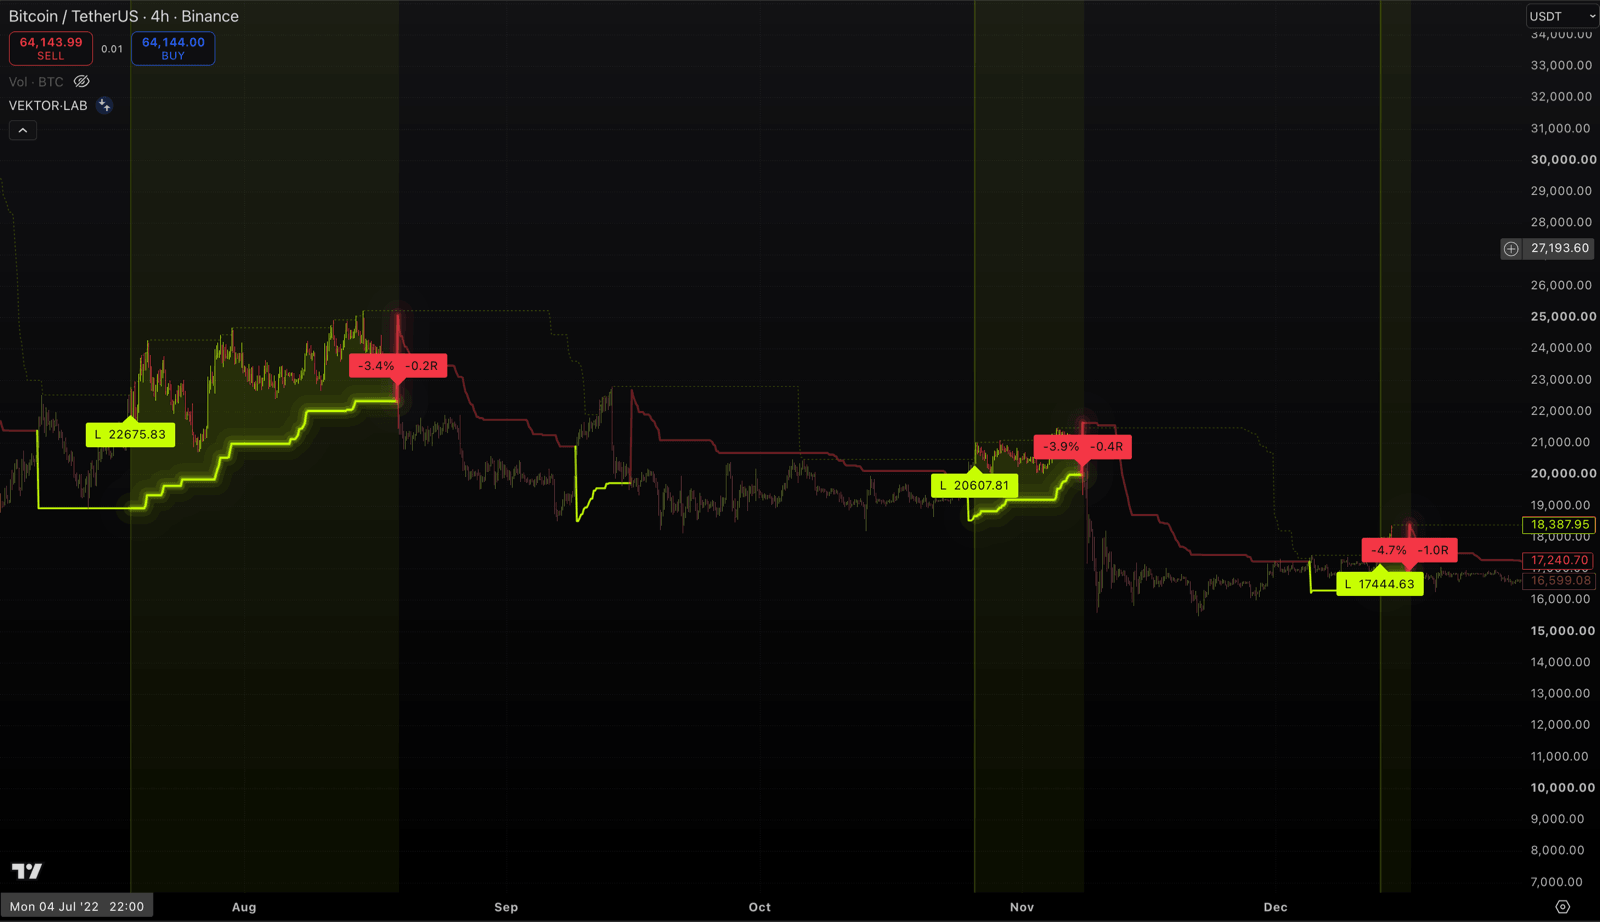
The bearBitcoin bled for half a year. Vektor spent most of it flat and paid three small losses — the biggest one 1R. It never rode the crash down. Defense is most of the job.
03 · Jul — Dec 2023BTCUSDT · 4H · Real screenshot
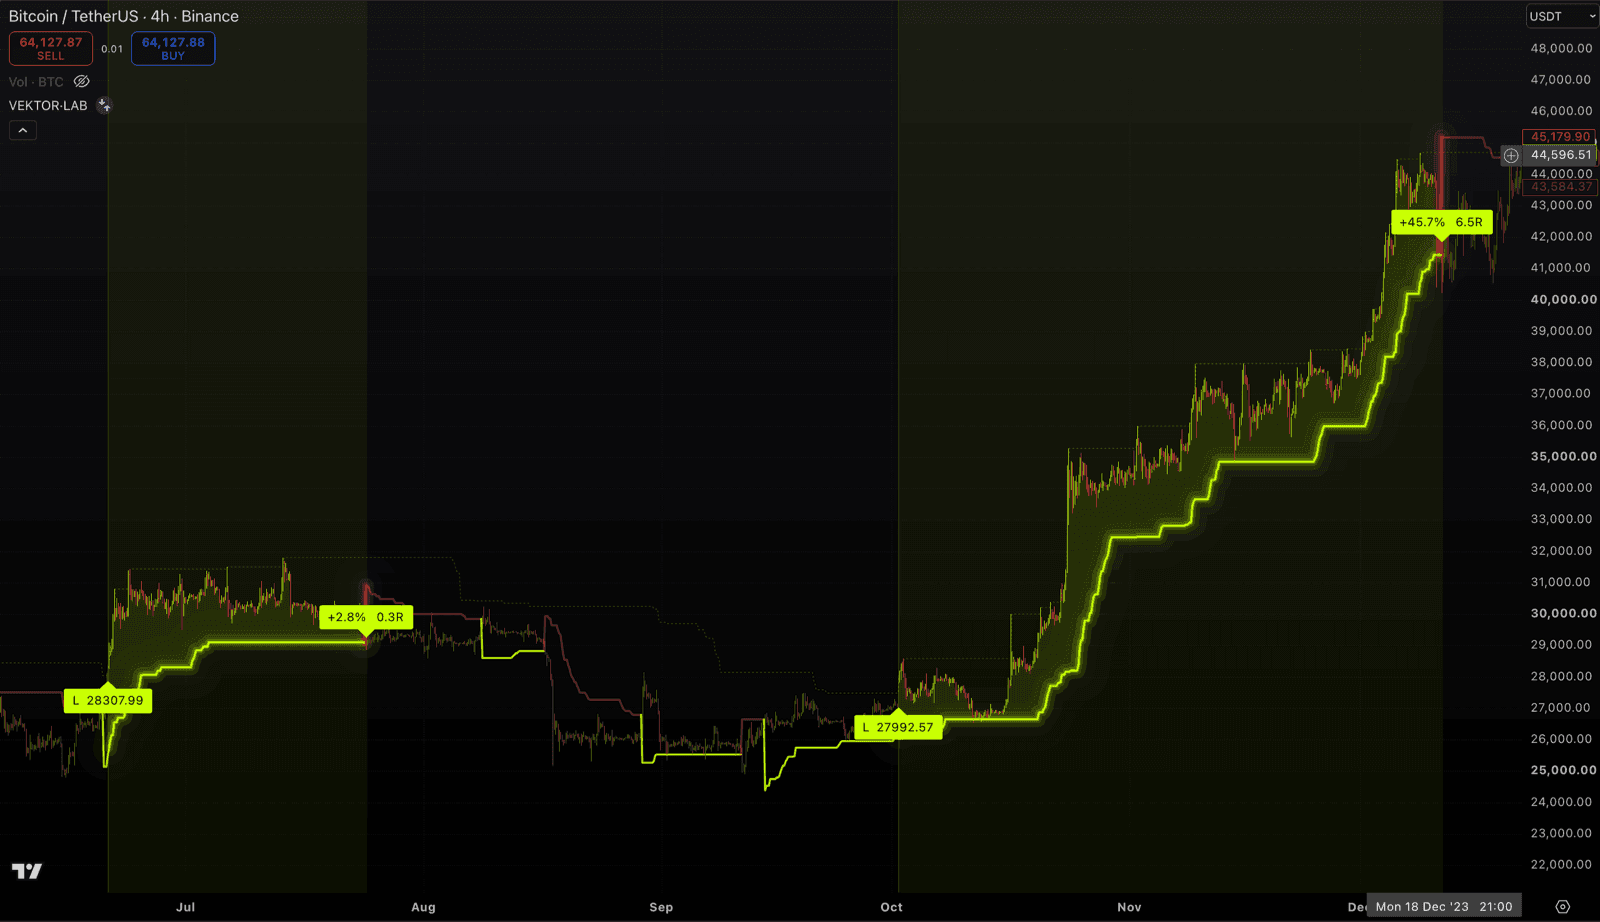
The quiet beforeA scratch exit in July, then months of waiting out the range. In October it took the turn at 27,992 and held on. Patience is a position.
04 · Sep 2023 — Mar 2024BTCUSDT · 4H · Real screenshot
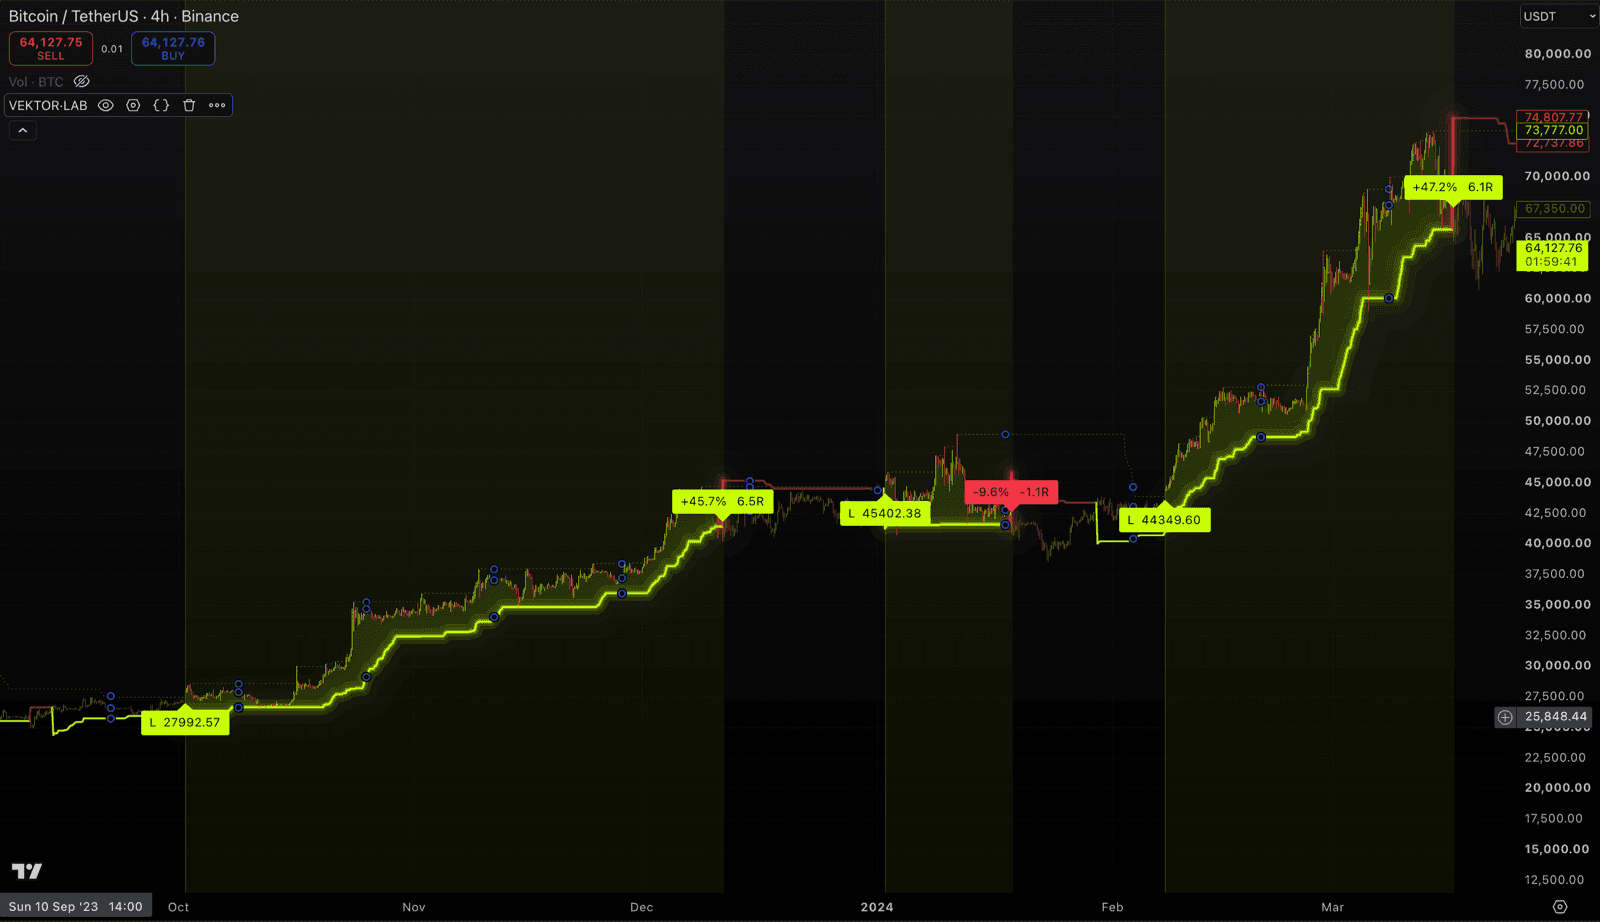
The runThe wide view of the same stretch: 27,992 became a 6.5R winner, January cost 1.1R, and 44,349 ran to 6.1R into March. Every label sits where it printed.
05 · Dec 2023 — Mar 2024BTCUSDT · 4H · Real screenshot
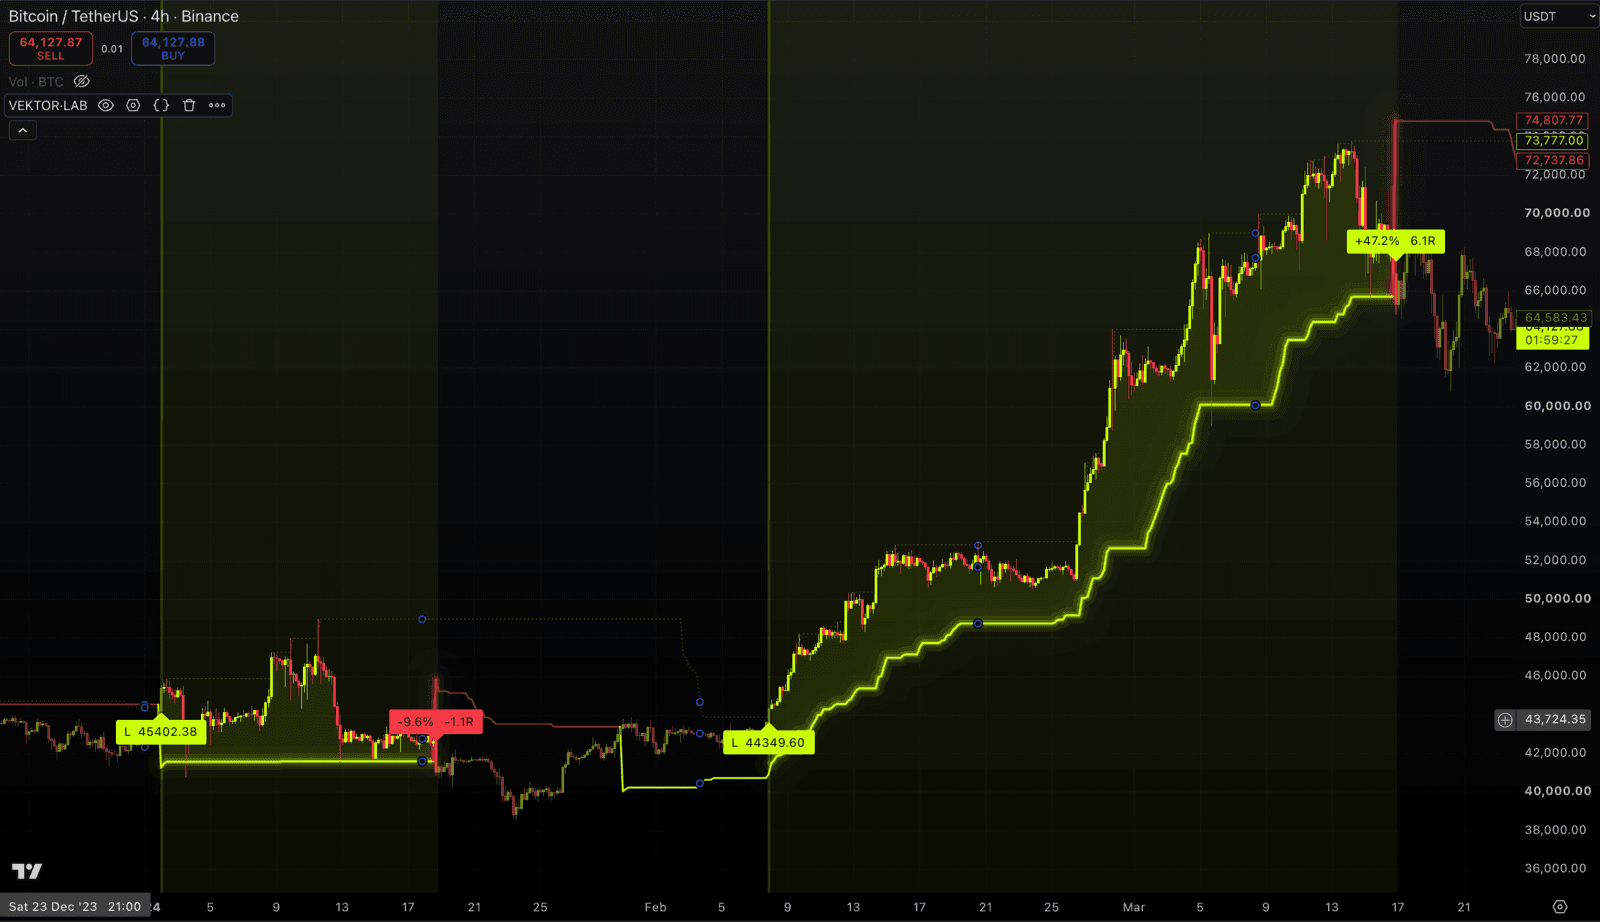
The loss, next to the winnerCloser in: one trade cut at −1.1R, and beside it one that ran +6.1R. Losses stay small, winners get room. That asymmetry is the whole edge — both halves on the same chart.
06 · Feb — Jun 2026BTCUSDT · 4H · Real screenshot
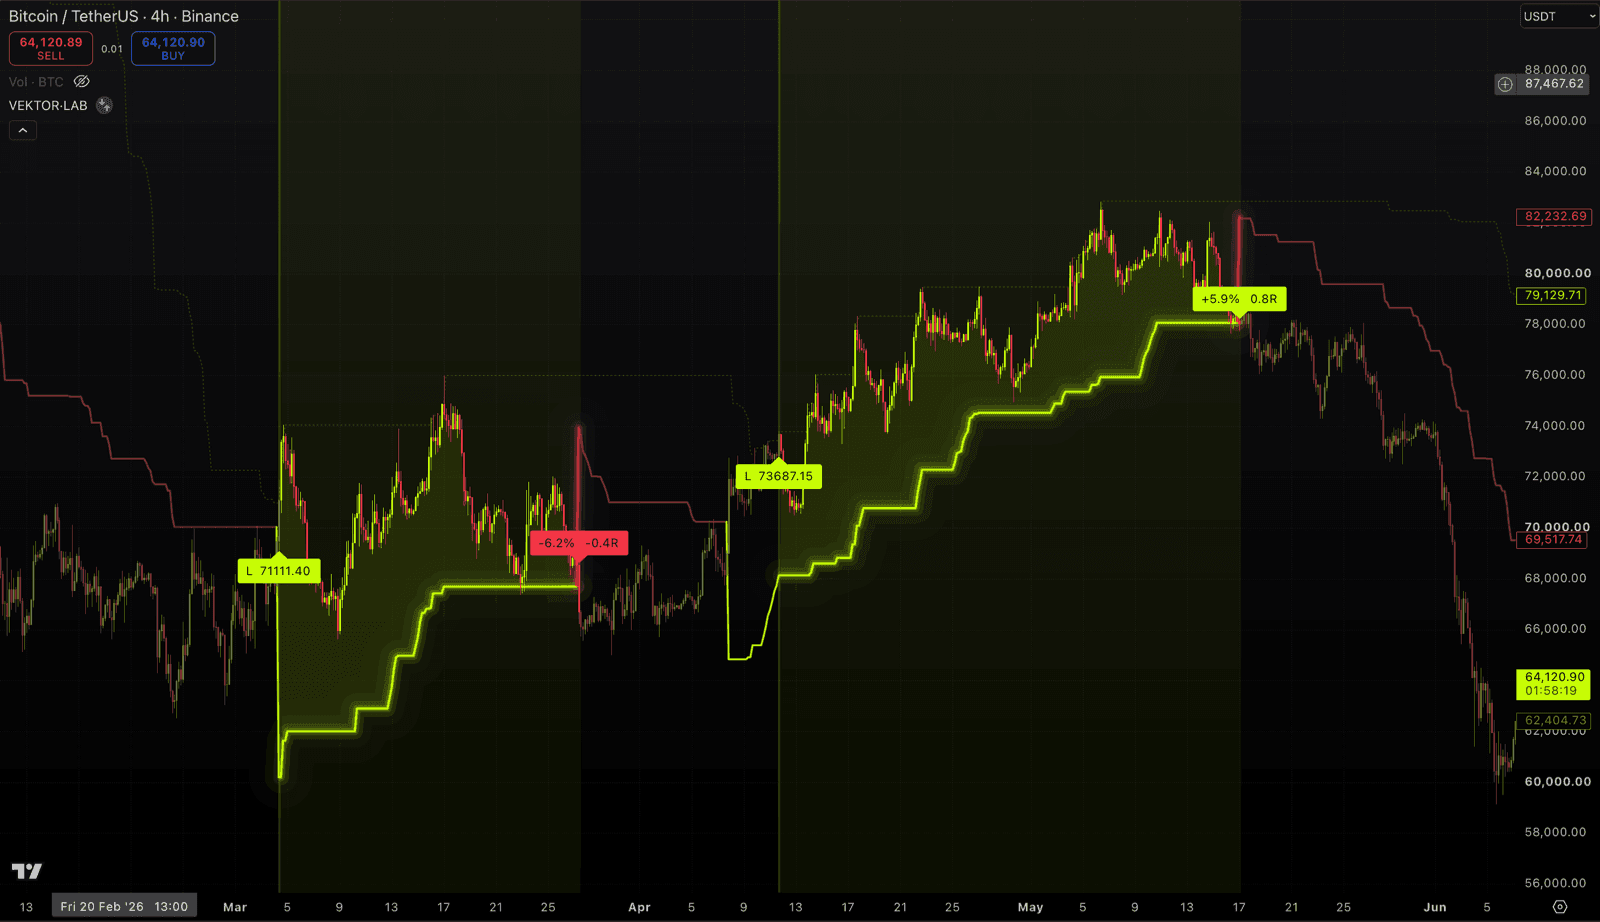
Recent tapeThis spring: a small loss, a small winner, then flat while the market slid. Not every stretch is a run — the tape shows those too. That is the point of showing it.
Every capture above is reproducible: add Vektor to a BTCUSDT 4H chart on TradingView, scroll back to the dates shown, and compare. Signals never move after they print.
Past results do not predict future results · Trading involves substantial risk