
What Is VWAP and How to Use It (Without Fooling Yourself)
The volume-weighted average price is the fair-value line day traders and desks lean on. Here is where it earns its keep, and where beginners quietly ruin it.
One warns you early and cries wolf. The other confirms late but keeps you out of the noise. Here is how to tell them apart and why durable systems lean on the slow one.
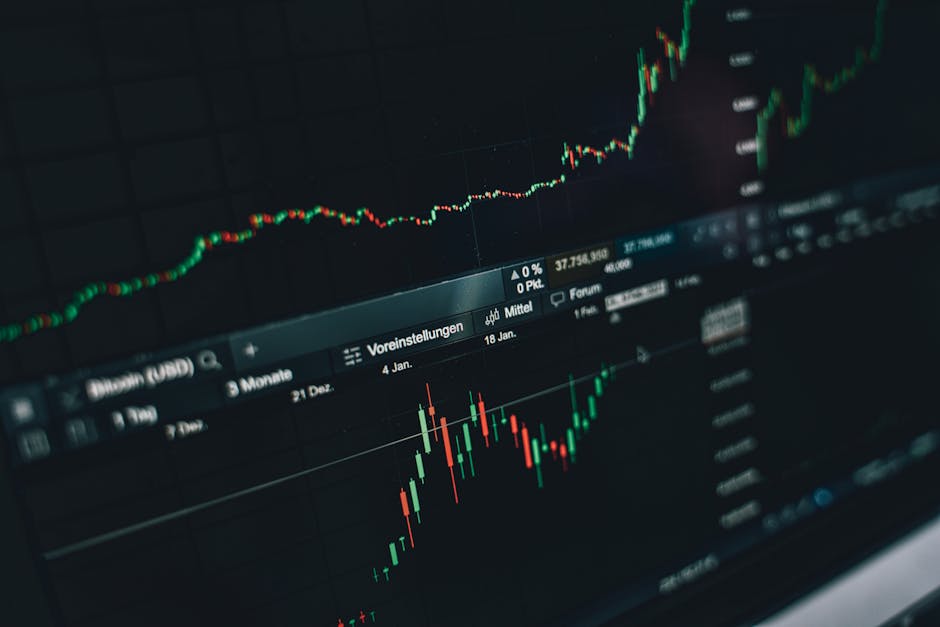
Every indicator is making one of two bets about the future. Either it is trying to tell you what is about to happen, or it is confirming what already did happen. That single distinction, leading vs lagging indicators, explains most of the arguments traders have about their charts, and it explains why two people can run the same tool and reach opposite conclusions.
The pitch for leading indicators is seductive: get in before the crowd, catch the turn, sell the top. The pitch for lagging indicators is boring: wait for proof, ride the middle, miss the exact bottom on purpose. Both descriptions are accurate. The interesting part is which trade-off actually survives contact with a live market.
A leading indicator attempts to signal a move before price confirms it. It reads momentum, stretch, or exhaustion and says the current direction may be running out of fuel.
The usual suspects here are oscillators. RSI flags when a market is overbought or oversold. The stochastic oscillator does something similar with a different formula. Divergence, where price makes a new high but the oscillator does not, is the classic leading tell that a trend is tiring.
When these work, they feel like magic. You short into strength a few bars before the reversal and look like a genius. When they fail, and they fail often, you are short into a trend that just keeps grinding higher because "overbought" is not a ceiling. It is a description of momentum, and strong momentum stays overbought for a long time.
That is the core weakness of leading tools. They generate a lot of signals, and a large share of them are noise. In a ranging market they can be excellent. In a trending market they will have you fighting the tape over and over. If you want to go deeper on the oscillator side of this, what is RSI divergence and the stochastic oscillator explained both cover the mechanics honestly.
Every early signal that turns out to be wrong costs you something. Sometimes it is a small loss. More often it is the slow bleed of commissions, spread, and the emotional wear of being stopped out three times before the real move happens. Traders underrate this because the wins from leading indicators are vivid and the losses are forgettable, one small red bar at a time.
The honest version of the leading-indicator pitch is this: you are trading a lower hit rate for the chance to be early. If your temperament and your system can handle a string of small losses without flinching, that trade can be worth it. If a run of red makes you double up or abandon the plan, it will quietly destroy you.
A lagging indicator does the opposite. It waits for price to move, then confirms that the move is real. It will never get you in at the exact bottom, and it is not supposed to.
Moving averages are the archetype. A moving average is literally an average of past prices, so it can only turn after price has already turned. A moving average crossover strategy does not predict anything. It tells you that the short-term average has crossed the long-term one, which is a way of saying a trend has established itself. The Supertrend indicator works on the same principle, flipping only after a move has proven itself with a buffer built in.
ADX belongs in this family too. It does not tell you direction. It tells you whether a trend has enough strength to be worth trading, which is confirmation of a condition rather than a prediction of one.
The strength of lagging tools is exactly what makes them feel slow. By waiting for confirmation, they filter out most of the small fake moves that trap leading-indicator traders. You give up the first slice of every move in exchange for a much higher chance that the move is real.
Lagging tools have their own cost, and it is symmetric. You enter late and you exit late. In a sharp reversal, a trailing exit gives back a chunk of the move before it tells you to leave. A trailing stop loss is the honest embodiment of this: it follows the trend and only pulls you out after price has already reversed by some amount. You will never sell the top with one. You will, however, stay in long trends far longer than your gut would let you, which is where most of trend following's edge actually lives.
So the lag tax is real, but it buys something valuable: fewer decisions, fewer false alarms, and a system that keeps you in the moves that matter.
| Leading | Lagging | |
|---|---|---|
| Goal | Predict the turn | Confirm the move |
| Timing | Early | Late |
| Signal count | High | Lower |
| False alarms | Frequent | Rarer |
| Best environment | Ranges | Trends |
| Main cost | Whipsaws | Missed early move |
| Typical tools | RSI, stochastic, divergence | Moving averages, Supertrend, ADX |
Read that table and one thing should jump out. The costs are not the same size in every market. In a choppy range, the whipsaw tax is small and being early pays. In a strong trend, the whipsaw tax is brutal and the lag tax is trivial. Since nobody knows in advance which regime they are in, the question becomes which mistake you would rather make repeatedly.
Here is the uncomfortable truth. Prediction is hard, and it is hardest exactly when it matters most, at the turns. Most traders who build a system around leading signals end up with something that looks brilliant in a sideways backtest and falls apart the moment a real trend shows up and refuses to reverse on schedule.
Confirmation is a lower bar to clear. Instead of guessing where the move goes, you wait for the move to declare itself and then follow. You will be late every single time. You will also be right about the direction far more often, and in trading, being on the correct side of a big move for the bulk of it beats nailing the top of a small one.
This is why trend following systems are almost entirely built on lagging confirmation. They are not trying to be clever. They are trying to be durable across regimes they cannot forecast. The whole design accepts a late entry and a late exit as the price of never having to predict anything.
That does not make leading indicators useless. It makes them a supporting cast member rather than the lead. A divergence can put a market on your watchlist. It just should not be the thing that pulls the trigger by itself.
The sensible combination is a two-step process. Use a leading read to notice, and a lagging read to act.
The trap to avoid is indicator stacking, where you pile on so many tools that some always disagree. When your leading and lagging indicators permanently conflict, you have not built a filter. You have built a machine for rationalizing whatever you already wanted to do. If you are wrestling with how many tools is too many, how many indicators should you use is worth a read.
Whatever you land on, test it before you trust it. The way to find out whether your mix leans too eager or too slow is to backtest it on TradingView across both trending and ranging stretches and watch where it bleeds. A tool like Vektor plots its exit as a non-repainting trailing stop and can show its result next to buy-and-hold on your chart, which is one honest way to see the lag trade-off in numbers instead of vibes.
A quick note on risk, since it applies to both camps: no indicator, leading or lagging, removes the chance of a losing streak, so size positions as though the next signal is wrong and let the math protect you.
Neither wins in the abstract. Leading indicators warn earlier but fire more false alarms. Lagging indicators confirm later but keep you out of a lot of noise. Pick based on whether your edge is being early or being right more often, and be honest that most people are steadier with confirmation.
RSI is usually treated as leading because it can flag overbought, oversold, and divergence before price turns. The catch is that a market can stay overbought or oversold for a long time in a strong trend, so an early RSI reading is a warning to watch, not a trigger to trade.
Moving averages are lagging by design. They average past prices, so they always turn after price does. That delay is the feature, not the bug. It smooths chop and confirms that a move has actually established itself.
Yes, and it is a common setup. Let a leading indicator flag a possible setup and a lagging indicator confirm before you act. Just do not stack so many that they always disagree, or you have built an excuse generator instead of a system.
The takeaway is not that lagging beats leading. It is that being late and right is a more repeatable business than being early and wrong. Build your entries and exits on confirmation, keep one or two leading reads as an early-warning radar, and test the whole thing on both trending and choppy data before a single dollar depends on it. If a run of small losses would make you tear up the plan, that is your answer: lean slow.
The volume-weighted average price is the fair-value line day traders and desks lean on. Here is where it earns its keep, and where beginners quietly ruin it.

ATR does not tell you where price is going. It tells you how far it usually travels, and that is exactly what you need to set stops and size positions that fit the asset.

ADX tells you how strong a trend is, not which way it points. Here is how to read it without fooling yourself.